BUILDING A LIFELINE
PIAI: Architecture — The Concepts, Capabilities, Connectors, Constructions Model for Diagrammatic Product Roadmapping
Experiment Box
(main post begins below this grey box)

For those who are aural learners, Google’s NotebookLM was used to auto-generate a podcast from this post. All I submitted is the URL for this post. No additional “human instruction”. Enjoy.

https://notebooklm.google.com/notebook/96ac1961-f1b8-4f0b-94df-c8471b9a37c8/audio
INTRODUCTION
I loved Lego (TM) as a kid. Still do. From my mother I learned to knit a bit. I have forgotten that skill as I grew but I recall the distinct delight of drawing pattern out of yarn. In this post we will draw on these tactile experiences of playing with bricks and yarn to build up another kind of composable play kit. In Lego and similar products, a small array of brick designs are composable into many many constructions, multiple products and product lines. Similarly in knitting, interlaced loops of yarn (stitches) create patterns of great beauty, complexity and utility from blanket to bib. In this post I’ll introduce a visual product roadmapping technique, the Concepts, Capabilities, Constructs, Connectors Model (C4M) and the story of its origin. C4M is an iterative collaborative drawing exercise that aligns the Why, the What, and the How aspects of Products. More importantly, it aligns a multifaceted diversely skilled product team of many threads into a single braided cord. The threaded skill sets include: subject matter experts, product maestros and a chorus of developers singing in various notes from data science to UI. It is a malleable Lego/Knitting kit for product design.
Some ideas burst out in a flash; C4M by contrast evolved over 20 years, incrementally across multiple analytics focussed product teams in different organizations and many many drawing sessions. It began messy, intuitive, concrete and over time the tinkering abstracted into a diagrammatic system based on four core elements:
Concepts — The Why’s, often tacitly known by subject matter experts and users circumscribed the client needs a product should serve.
Capabilities — The What’s, the modular pieces of functionality we must create to build a product. Pieces which in principle can be built in parallel. A Capability and its capsule definition serve as a summary of Requirements from a product perspective. It can lead to a technical Specification, which will then guide the implementation. In the diagrammatic it is represented as a node.
Connectors — The means by which we are able to connect capabilities: API’s, Databases, shared data structures and common file formats. The “How’s”require an alignment of product and technical considerations. In the diagrammatic it is represented as an edge; and usually represents flow of information across modular capabilities. Connectors act like the nubs on a Lego block — allowing one kind of brick (a capability) to connect to another.
Constructions — An assembly of capabilities that represents the product design diagrammatically. Within C4M an “Assembly” is a construction that acts as an internal product, and “Product” is reserved for the external client facing constructions.
The above six bolded terms define the basic glossary of C4M. As a diagrammatic system, we first define the “Why” Concepts in terms that need to be understood across the team. If they are not understood; the SME’s need to teach them formally or informally. Next, we have a set of Capabilities, which are product components that can be designed independently. The design of Capabilities is more general than, and constrains, subsequent technical decisions as to infrastructure, technical stacks, etc. The Capabilities require Connectors so they can interact with other capabilities to form Assembliescand final Products. C4M is pure design thinking; mapping SME knowledge about Why to a Product abstraction of What to finally collaboratively begin defining How via combining capabilities. SME, Prod & Tech begin aligned. In some organizations Prod & Tech may be separate teams; in others commingled into a multifaceted Product Team; and in startups; individuals are often playing multiple roles: SME, Product, Tech.
ORIGIN OF C4M
20 years ago (circa 2003-2004), I was part of a product team that stumbled onto a radical agile product collaboration and roadmapping technology. It had a great UI. It was immersive. It was easy to update, but maintained history. It was fault tolerant. Cost effective.
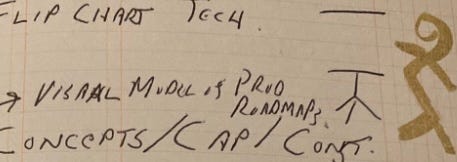
It was a flip chart.
We had been using this flip charting approach for a couple of years. Indeed the more formal product roadmaps I produced for Stakeholders were largely cleaned up versions of our regular flip chart sketching sessions with additional written documentation. We were going to stress test our collaborative drawing approach by using it to guide a major capabilities overhaul that touched almost every part of the existing systems major components.
The team was multi-skilled. Foresters. GIS analysts. Programmers. Database specialists. Statisticians. PO’s. We had 6 weeks to add a brand new capability to the third iteration of a software product called “LifeLine” Lifeline had been under development since 1998, and had gone through multiple iterations. LifeLine allowed Forest managers to ask questions of a complex data warehouse, without any knowledge of the underlying database design, or of SQL. Its UI was configurable and created a tree-like diagram of concepts a forester understood (Ecosystems, Stands, Plots, Trees). A forest manager could click through the tree UI to define and run scenarios and could combine simple saved scenarios into more complex ones. Well named atomic scenarios created a vocabulary of base concepts that could be combined to develop more complex concepts.
Here is an example of its functionality circa 2002 from the user manual which was inspired by the dialog format in philosophy and science, in this case a dialogue between a forester named Joe and a statistician named Yid.
The new capabilities demanded by the client were two fold. (1) That the product be spatially enabled. (2) That the final output be a map. Why a map? Foresters love maps. Give them a well formatted table, and they say: “Excellent, can you put it on a map.” Give them a simple visualization of a complex model combining actuarial and fuzzy logic techniques and they remark: “Awesome, can you put it on a map”. Even today, after working in several different industries, I find my thoughts straying to : “How would these model outputs look on a map”. If Excel is the universal interface for Finance; maps are the universal interface for field Foresters.
We were early adopters of SCRUM (after a misadventure with XP), expert at burndown charts. Minimalists by nature we wrote as little documentation as possible. We counted on the UI to be “intuitive” after a five minute demo (20 years hindsight later; this was likely naive). We were a fast team.
But we needed to go even faster. To meet the short timelines we needed to break up the work; rapidly create multiple prototypes in tandem; test the interactions and pull out a large change in the products core capabilities to enable both spatial querying and web mapping. All without breaking anything; preserving the original UI as much as possible; so minimal retraining in the product was required.
Tyler was the offsite product owner, GIS consultant and open source champion. I was the on-site product owner, forester SME, statistician SME, QA/UI-Tester/Breaker, and $ in/out bean counter. Everybody else on the 7 person team was similarly multifaceted. We all wore multiple hats, and passed them around.
Both the Product Roadmap and the System Architecture were hashed out on the flip chart. It was the point of alignment. It was where we worked out the product iteration by iteration.
The Product Roadmap then became a layering of sketches defining what the product needed to be from a SME/User perspective. It looked a bit like the diagram version of an archeological site.
These diagrammatic ideas were nascent at the beginning; at least partly tied to the groups common familiarity with GIS which meant we were all comfortable thinking in points/lines/polygons ; ie graphs, so a simple visual language came naturally to the team. We were all happy to pull out fluorescent highlighters and fill up blank pages together.
The core technical concept in LifeLine was that everything is a directed graph. The UI represented the data model as a directed graph. Queries were automatically generated as paths through the graph.
Basic ideas in forestry were then represented as such directed graphs using common terms most foresters intuitively understood. This allowed us to capture a large amount of forestry knowledge in a tree structure that served as an informal ontology. This tree structure of well understood terms was often simplified from the original source database structure(s).
The final concept we wanted to implement was to thematically layer a map on the fly using these ideas. At one moment the map would identify all large Douglas Fir stands near a mill with low slope values (easy to harvest). At another moment the map would identify stands with a particular combination of tree species existing in a specific ecosystem (an ecosystem we needed to preserve in the landbase). These ideas defined a UI that matched how Foresters thought about these issues; and how they verified databases and monitoring programs that predated them; by taking the map out to the field and going for a walk in the woods to verify it.
From these basic concepts a small set of capabilities were defined:
Quality Assurance(QA) — Ability to QA and Integrate many smaller databases with similar but not identical Schema. Requires: Keys unique, aliases, referential integrity, numerical range checks, categorical/text label checks; column name checks, no hanging children; lookups when spatial and tabular keys were not 1-1.
Spatially Referenced — Ability to link these databases constructed at different times and independently of each other through the only information they shared: everything had a spatial location. Either as a point or a polygon. (see spatial key lookups above)
Configurable by Graph — Ability to have a simple tree-diagram UI that could be configured to support multiple databases regardless as to whether they were tree measurements, Forest cover information, ecosystem information, or even river and terrain information.
Scenario Driven — Ability to translate a scenario defined on the tree diagram to generate a query. That query had to be deployable to multiple proprietary and open source databases — as we were not in a position to decide for stakeholders which database they would use. Queries needed to be saleable as scenarios from which they could be reconstructed and also combined to create more complex scenarios.
Dynamically Composable — Ability for the scenario to dynamically update a map. As scenarios were updated and refined, the thematic layer defined by the query kept getting redrawn. Simple queries could be saved, and composed into more complex queries. Careful choice of Query Naming conventions created a small grammar of “atomic” scenarios that could be composed into more complex scenarios.
These were the core capabilities; they could be more succinctly stated within the team; as most gelled teams develop their own Atriedes battle language of short acronyms and terms (occasionally hand signals for meetings with other stakeholders). These capabilities are common today (2024). In 2003-2004 they were less so.
The final realization of these capabilities was a simple workflow:
Tree UI —> Scenario Engine <—> Query Generator —> Tabular Outputs (rows, aggregate) + Map Outputs (points, polygons)
where,
—> is a unidirectional connector
and
<—> is a bidirectional connector.
The essential connector was an SQL query, generated in the UI, sent to the database, and finally the web mapping system.
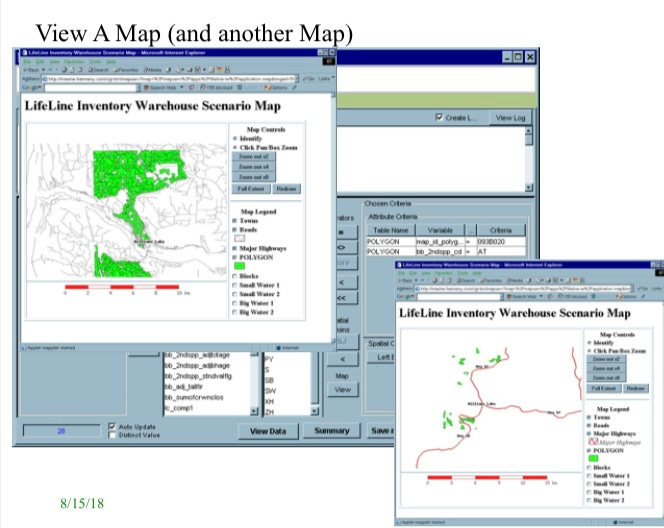
The resulting UI and outputs now looked like this.
The UI could be on a desktop or laptop in one location, the database could be at a second location and the web mapping system could be at a third location. So as an emergent capability (not explicitly considered at design time) we had a simple distributed system that was effectively loosely coupled.
I can’t recall if we made the 6 week deadline, but it was close. Every few days we reviewed the flip chart, often scratching something out and drawing in something new. To someone outside the team; the multiple layers of colour; crossed out sections; occasional jokes, and scrawls of different handwriting were likely indecipherable archeological dig on a flipchart. To the team; it was simply our roadmap — a way to stay aligned while working largely independently as fast as we could, while checking in regularly via looking over each other’s shoulder and having another flipchart session whenever required.
The flipchart sketches at that time often strayed from requirements to specifications to technical details to algorithm outlines in pseudocode.
Over years, teams, time, the sketching process became sparser and sparser; stayed largely at the level of requirements and began to look more like a formal network diagram. Which is what the C4M is. Specifications and Implementations are lower level. They have a one-to-many relationship with the C4M diagrammatic.
In 2004, the technologies used were:
UI in JBuilder (a Java IDE by Borland)
ETL tools in MS Access
Databases and data warehouse could be in any one of the following: Access, Oracle, PostGIS. In principle any ANSI SQL 92 compliant database; as that is what our query engine produced . PostGIS was required if you wished the mapping capability.
What technologies would you consider today?
If we wish to advance our UI concepts a bit from 2004 to 2024, it would make sense to ride the “AI First” wave and consider
A Prompt alternative to the UI Tree interface for new users;
with UI tree as Power User mode, for SMEs who know the grammar of a particular domain; and so can click faster on just what they want than write out a full sentence(s).
An DAG solution for configuration rather than overloading a tree based UI element.
The Forestry Applications we built were constructions. The core capabilities had nothing specifically to do with forestry; though they originated in meeting requirements based on forestry SME concepts. The process of abstracting from concepts to capabilities generalizes; allowing these capabilities to now be available for different concept mixes in other fields; closely related or even far afield.
We could have been building a book inventory system; or a warehouse of spatial information on electrical transmission lines, or an early warning system for extreme weather events that can damage physical infrastructure. These would have led to different configurations to set up those products; perhaps the need for additional capabilities to be developed — but would not necessarily change the high level product design of the capabilities already in place.
Which is why this approach leads to product Lego Kits where product design can ride above specification and tech stack details. Modularity, whether in infrastructure, software, or biology, allows evolvability. Tech stacks change quickly. Good design abstractions change more slowly and absorb sequential and concurrent tech stacks.
The C4M model is a way to collaboratively arrive at evolveable products; and via the capabilities of existing teams; have a way to tinker together new products which were not imagined at the time the original capabilities were designed. As if a construction kit of walls, windows, and doors for designing buildings suddenly morphed into a design kit for floral bouquets.
Thanks for reading Product Innovation AI. If you liked this post, please click ♡ button below to help product innovation ai grow.
Subscribe for free to receive new posts and support this work.


